
Generalization in Tactile Cartography
Generalization is a method of selecting and abstracting map content that involves intentionally revealing and isolating the typical features and characteristic properties of the represented terrain objects and phenomena to create a true cartographic image that corresponds to the map’s purpose (Grygorenko, 1970). In other words, generalization means representing the most significant, typical terrain objects, phenomena, and their characteristic features on a map, while simultaneously omitting secondary, less significant elements. In tactile cartography, the number of objects or phenomena and their features depicted on the final map additionally depends on the perceptual capabilities of the tactile map user, who reads it by touch and, to a limited extent, also by sight. Therefore, the scope of tactile map content and its representation method must be adapted to tactile perception. Its resolution—understood as the ability to distinguish two objects as separate—is approximately 10 times lower than visual perception (Klatzky & Lederman, 2003; Więckowska et al., 2012; Yanoff & Duker, 2009). Consequently, ensuring tactile legibility is a key issue when developing tactile maps, which requires a high degree of generalization of the map content. The general principles of generalization for tactile map development are essentially the same as in classical cartography. The only difference lies in the necessity to account for the perceptual requirements of blind and visually impaired people from the very beginning. These requirements primarily concern the size and shape of symbols that can be recognized and differentiated by touch, their number on a single sheet, as well as the need for larger spacing between symbols to ensure their tactile distinctiveness. It is generally accepted that the number of unique tactile symbols on a single tactile map sheet should not exceed 10. In exceptional cases, where most of the symbols used are point symbols, this number can be increased to 15 (Rowell & Ungar, 2003). Hence, the number of unique types of objects left on the map after generalization should correspond to the aforementioned number of permissible cartographic symbols. The optimal size of point symbols placed on tactile maps reported in the literature varies significantly. Więckowska et al. (2012) recommend symbols as small as 3–5 mm, while other authors suggest sizes of 4–6 mm (The NSW Tactual and Bold Print Mapping Committee, 2006), 6 mm (BANA and the CBA, 2010), or even 10 mm (ISO, 2016). Such large discrepancies may result from the use of different raised-line printing techniques, which, however, is rarely specified in the literature. Spacing between symbols is also crucial so that each of them can be tactilely isolated as a separate symbol. Mościcka et al. (2024) recommend a distance of 2 mm between symbols with different geometries (point-to-line) and 4 mm for symbols with the same geometry (polygon-to-polygon). These values have been tested in 3D printing and UV printing techniques as sufficient to maintain tactile map legibility. The minimum dimensions of linear and areal elements distinguishable by touch are defined somewhat more precisely than those of point symbols. The minimum length of a linear element placed on tactile maps should not be shorter than 13 mm (Edman, 1992; Regis & Nogueira, 2013). This means that all shorter linear objects should be removed during generalization or enlarged. The minimum size of an areal object that can be represented on a tactile map should not be less than half a square inch (approx. 3.2 cm²) (Heath, 1958). Objects with a smaller area should be removed during generalization because they will not be recognized by the user as areal regions. The sizes mentioned above are merely examples of requirements stemming from tactile perception that influence the degree of map content abstraction. Crucially, the core principles of generalization for tactile map development remain identical to those in classical cartography. The most important factors in generalizing map content are always (Grygorenko, 1970; Saliszczew, 2002): the purpose and theme of the map, its scale, the characteristics of the mapped area, and the nature of the source materials. These factors determine which elements will be represented on the final map (including tactile map) and how, and which will be omitted and/or simplified. When generalizing tactile map content, two methods of generalization are also applied: qualitative generalization and quantitative generalization. Qualitative Generalization Qualitative generalization involves abstracting the characteristics of objects and phenomena represented on the map. This abstraction includes replacing elementary concepts with higher-level, more synthetic concepts; in other words, a detailed classification is replaced by a generalized one. This abstraction encompasses the following generalization operators:
- Grouping (reclassification): results in the creation of higher conceptual categories, which reduces the number of symbols on the map. Grouping involves combining phenomena and objects that are closely related in terms of classification into groups and giving them a cartographically uniform appearance—for example, replacing separate symbols for deciduous and coniferous trees with a single tree symbol (Fig. 1);
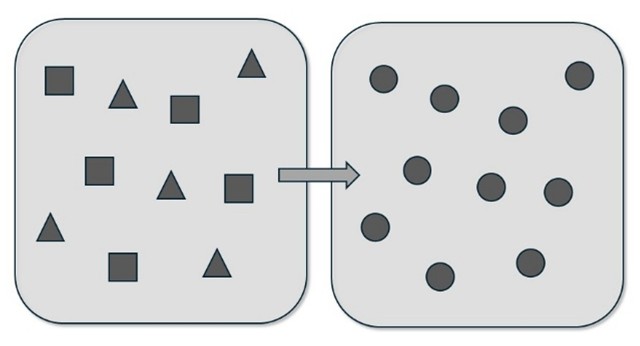
Figure 1. Qualitative generalization – grouping
- Symbolization: for example, replacing an areal (polygon) symbol with a point symbol (e.g., while a larger-scale map depicts the boundaries of a built-up area, when switching to a smaller-scale map, it is replaced by a settlement symbol—a circle or square point symbol) (Fig. 2);
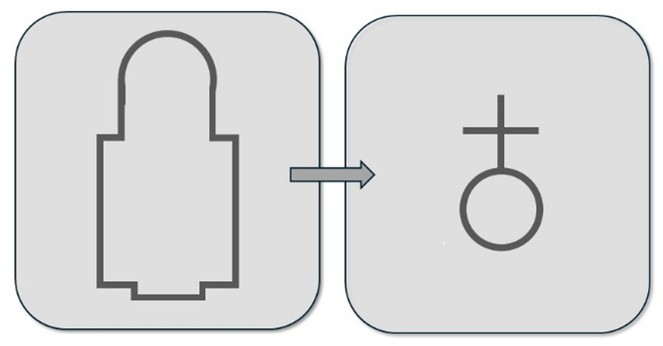
Figure 2. Qualitative generalization – symbolization
- Changing the approach to a phenomenon: moving from a direct representation to an indirect representation, whereby the image of isolated data distribution on the map is replaced by the relationship of that phenomenon to an area—for example, shifting from depicting the actual course of roads to presenting road density within a given area. This involves changing the cartographic presentation method, in this case, from the linear symbol method to a choropleth map (Fig. 3).
Figure 3. Qualitative generalization – changing the approach to a phenomenon Quantitative Generalization Quantitative generalization involves the selection and simplification of map content elements. It consists of choosing the terrain objects and phenomena that should be depicted on the map in accordance with its purpose, and subsequently generalizing their outlines. Quantitative generalization encompasses the following generalization operators:
- Content generalization: which involves reducing the number of symbols on the map; more significant map elements are selected while less important ones are omitted (e.g., omitting smaller cities, shorter rivers, or minor roads);
- Form generalization: which is the generalization of the spatial relationship model’s structure in terms of location. It consists of reducing the image of reality while maintaining specific objects and the spatial relationships between them in such a way as to preserve the most crucial spatial characteristics and omit less essential ones.
Form generalization primarily includes:
- Shape simplification: which applies to linear and areal features (Fig. 4). It involves simplifying all lines on the map, including those of both natural and anthropogenic features (e.g., shorelines of surface waters, pathways, streams). This requires omitting smaller, secondary shapes while preserving the most characteristic, typical, and general features. Shape simplification consists of eliminating selected points that define a line or polygon and retaining those that are most essential for maintaining the character of the line represented on the map (Robinson et al., 1995).
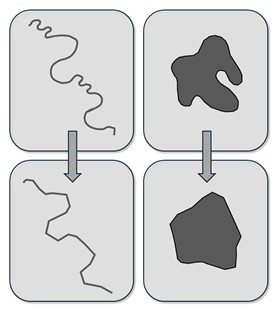
Figure 4. Form generalization – shape simplification
- Smoothing: which occurs after line simplification and involves making corrections and minor adjustments to the positions of points to eliminate jagged, sharp bends in the line (Fig. 5). The purpose of smoothing is to give the shapes of objects a more natural appearance. When developing maps for the blind and visually impaired people, smoothing is of particular importance because it gives objects gentle contours and, consequently, prevents the user’s fingers from being scratched or irritated by the sharp edges of simplified objects.
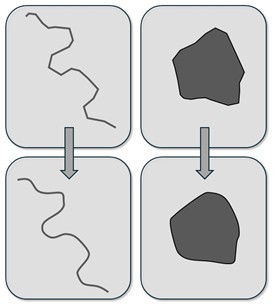
Figure 5. Form generalization – smoothing of a simplified shape
- Aggregation: which applies to areal features on a nominal scale. Aggregation involves combining objects with the same qualitative characteristics into one larger object; in other words, it consists of replacing several separate areal features with a single object (Fig. 6). This is performed when the areas or lines are too small to be included on the final map, or when the spacing between them is too small to be represented at the map’s scale. Combining the objects allows for an accurate reflection of the area’s characteristics.
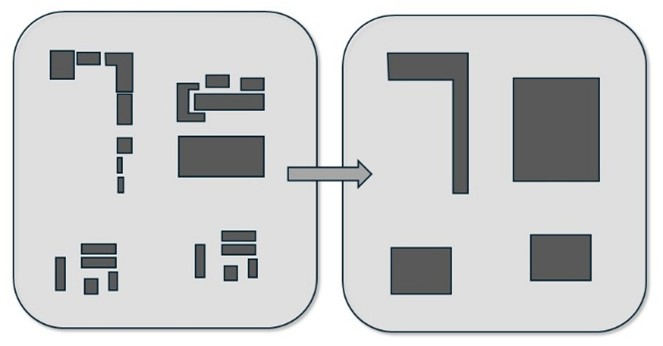
Figure 6. Form generalization – aggregation
- Exaggeration (enlargement): which applies to point and areal features that would otherwise be omitted during generalization (due to being smaller than the established criteria), but whose significance for defining the area’s characteristics is important enough that they are enlarged and made clearer to emphasize their role in describing the area (e.g., an isolated, single grove of trees in a field);
- Selection of representative elements (selection): retaining a few exemplary elements that reflect the character of the area (Fig. 7), chosen from a large number of small elements (e.g., selecting only a few trees out of many);
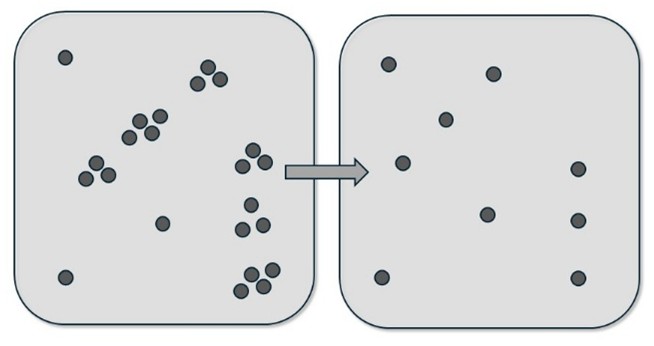
Figure 7. Form generalization – selection of representative elements
- Dimensionality reduction: replacing areal features with point or linear features (Fig. 8) when the area is too small to be represented at the map’s scale, yet the object’s significance in characterizing the area is important enough that it must be retained on the map (e.g., a large areal object is represented as a point).
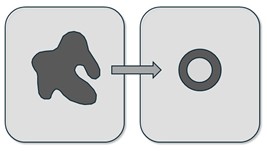
Figure 8. Form generalization – dimensionality reduction Note: Bearing in mind that dimensionality reduction (form generalization) is frequently confused with symbolization (content generalization), the differences between these two operators are presented in Table 1. Table 1. Differences between dimensionality reduction (form generalization) and symbolization (content generalization)
| Feature | Dimensionality reduction (form) | Symbolization (content) |
| Main objective | Simplifying the geometry of the object | Classifying the object into a category |
| What changes | Mathematical dimension (polygon à point) | Method of graphical representation of meaning |
| Context | Driven by a lack of space at a given scale | Driven by the need to hierarchize information |
| Example | Replacing the width of a river with a single line | Replacing the outline of a factory with a chimney symbol |
Generalization is the most difficult and highly subjective process in both traditional and tactile cartography. For this reason, there are no rigid, strictly parameterized rules that automatically dictate how map content should be abstracted. Guided by the fundamental methods and operators of generalization—and keeping in mind the scale and purpose of the map—it is the cartographer who must decide what to generalize and how. In tactile cartography, one must always remember that the paramount principle is ensuring the final map remains completely legible to the blind user. Without this, the entire effort will be in vain.
References
- Braille Authority of North America. (2022). Guidelines and standards for tactile graphics. https://www.brailleauthority.org/sites/default/files/tg/Tactile%20Graphics%20Standards%20and%20Guidelines%202022_a11y.pdf
- Edman, P. K. (1992). Tactile graphics. American Foundation for the Blind.
- Grygorenko, W. (1970). Redakcja i opracowanie map ogólnogeograficznych. Państwowe Przedsiębiorstwo Wydawnictw Kartograficznych.
- Heath, W. R. (1958). Maps and graphics for the blind: Some aspects of the discriminability of textural surfaces for use in areal differentiation (Doctoral dissertation), University of Washington.
- International Organization for Standardization. (2016). ISO 19028: Accessible design—Information contents, figuration and display methods of tactile guide maps.
- Klatzky, R. L., & Lederman, S. J. (2003). Touch. In A. F. Healy & R. W. Proctor (Eds.), Handbook of psychology: Vol. 4. Experimental psychology (pp. 147–176). John Wiley & Sons.
- Mościcka, A., Śmiechowska-Petrovskij, E., Wabiński, J., Araszkiewicz, A., & Kiliszek, D. (2025). Methodical testing of tactile cartographic signs in isolation and in context. Cartography and Geographic Information Science, 52(2), 181–198. https://doi.org/10.1080/15230406.2024.2379456
- Regis, T., & Nogueira, R. E. (2013). Contribuição para o ensino-aprendizagem de geografia: A padronização de mapas táteis. In 14° Encontro de Geógrafos da América Latina: Reencuentro de Saberes Territoriales Latinoamericanos. http://observatoriogeograficoamericalatina.org.mx/egal14/Ensenanzadelageografia/Metodologiaparalaensenanza/56.pdf
- Robinson, A. H., Morrison, J. L., Muehrcke, P. C., Kimerling, A. J., & Guptill, S. C. (1995). Elements of cartography (6th ed.). John Wiley & Sons.
- Rowell, J., & Ungar, S. (2003). The world of touch: Results of an international survey of tactile maps and symbols. The Cartographic Journal, 40(3), 259–263. https://doi.org/10.1179/000870403225012961
- Saliszczew, K. A. (2002). Kartografia ogólna (3rd ed.). Wydawnictwo Naukowe PWN.
- Więckowska, E., Chojecka, A., Mikołowicz, B., Fuksiński, C., Mendruń, J., Olczyk, M., & Rudnicka, M. (2012). Standardy tworzenia oraz adaptowania map i atlasów dla niewidomych uczniów. https://tyflomapy.pl/files/33160/Standardy_tworzenia_oraz_adaptowania_map_i_atlasow_dla_niewidomych_uczniow.pdf
- Yanoff, M., & Duker, J. S. (2009). Ophthalmology (3rd ed.). Mosby Elsevier